Amorphization of a Slater-Koster model#
In some cases, we might be interested in introducing structural disorder in a Slater-Koster model
that we have previously defined. To do so, the library provides an additional class named
tightbinder.models.AmorphousSlaterKoster, which extends tightbinder.models.SlaterKoster
such that hoppings are modified according to the distance with respect to the reference (crystalline) positions.
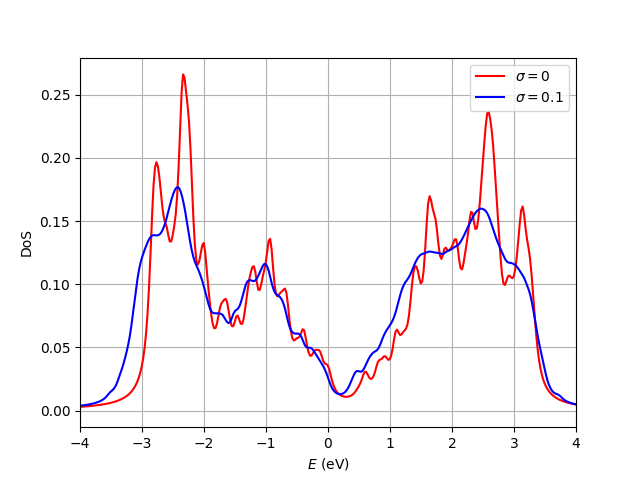
Here we showcase this class, and use it to compare the density of states of the crystalline and slightly disordered crystal.
amorphous_slater_koster.py#
# In this script we show how to create an AmorphousSlaterKoster model, and to use it
# to compare the density of states at different disorder values

from tightbinder.models import AmorphousSlaterKoster
from tightbinder.disorder import amorphize
from tightbinder.observables import dos
from tightbinder.fileparse import parse_config_file
import matplotlib.pyplot as plt
import numpy as np
from pathlib import Path


def main():

    # Parameters of the calculation
    ncells = 12
    dos_npoints = 1000
    delta = 0.08
    disorder = 0.1

    # Parse configuration file
    path = Path(__file__).parent / ".." / "examples" / "inputs" / "Bi111.yaml"
    config = parse_config_file(path)

    # Init. model and construct supercell
    first_neighbour_distance = np.linalg.norm(config["Motif"][1][:3])
    cutoff = first_neighbour_distance * 1.4

    model = AmorphousSlaterKoster(config, r=cutoff).supercell(n1=ncells, n2=ncells)
    model.decay_amplitude = 1

    # Compute density of states for the crystalline system
    model.initialize_hamiltonian(override_bond_lengths=True)
    results_crystalline = model.solve()
    results_crystalline.rescale_bands_to_fermi_level()

    dos_crystalline, energies_crystalline = dos(results_crystalline, delta=delta, npoints=dos_npoints)

    # Disorder system and compute density of states
    model = amorphize(model, disorder)
    model.initialize_hamiltonian()
    results_amorphous = model.solve()
    results_amorphous.rescale_bands_to_fermi_level()
    dos_amorphous, energies_amorphous = dos(results_amorphous, delta=delta, npoints=dos_npoints)

    # Plot both densities of states
    fig, ax = plt.subplots(1, 1)
    ax.plot(energies_crystalline, dos_crystalline, 'r-', label=r"$\sigma=0$")
    ax.plot(energies_amorphous, dos_amorphous, "b-", label=r"$\sigma=0.1$")
    ax.set_xlabel(r"$E$ (eV)")
    ax.set_ylabel("DoS")
    ax.grid("on")
    ax.legend()
    ax.set_xlim([-4, 4])


if __name__ == "__main__":
    main()
    plt.show()
This produces the following plot: