Band structure of a ribbon#
The following script shows how to generate a ribbon of a given material, i.e. how to reduce the dimensionality of the system along
one specified direction, and obtain the bands of the new system. Note that here, for Bi(111) which has a honeycomb lattice, the generated
ribbon is not rectangular but has diamond shape. To generate a rectangular ribbon, one can use instead the method tightbinder.system.System.ribbon(),
which is specific to honeycomb lattices.
bands_ribbon_bi111.py#
from tightbinder.models import SlaterKoster
from tightbinder.fileparse import parse_config_file
import matplotlib.pyplot as plt
from pathlib import Path
def main():
# Parse configuration file
path = Path(__file__).parent / ".." / "examples" / "inputs" / "Bi111.yaml"
config = parse_config_file(path)
# Init. model and consider a finite supercell along one Bravais vector
width = 15
model = SlaterKoster(config).reduce(n1=width)
# Create k point mesh
nk = 100
labels = ["K", "G", "K"]
kpoints = model.high_symmetry_path(nk, labels)
# Initialize Bloch Hamiltonian and obtain the band structure
model.initialize_hamiltonian()
results = model.solve(kpoints)
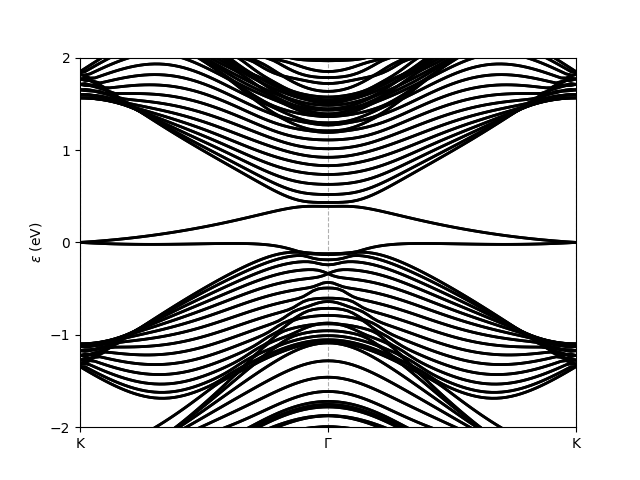
# Plot bands of the ribbon; restrict energy window to [-2, 2] interval.
results.plot_along_path(labels, e_values=[-2, 2])
if __name__ == "__main__":
main()
plt.show()
Executing this script results in the following plot: